Use Our Mapping Feature To Search Homes For Sale Via The Kansas City MLS

Checking The Pulse Of The Kansas City Real Estate Market

Search area homes for sale using mapping features of listings fed from the Kansas City MLS. Locate homes currently for sale in Kansas City, Johnson County Kansas, Overland Park, Olathe, Lenexa, Leawood, Shawnee and the surrounding metro areas! Click the map below to get started…

Photo 1244


Posted by Jason Brown

View Nearly 250 Homes On The Fall 2012 Kansas City Parade Of Homes Tour

Checking The Pulse Of The Kansas City Real Estate Market

The Fall of 2012 Kansas City Parade of Homes tour begins tomorrow, Saturday 9/29. The Parade of Homes runs through Sunday October 14th this year and there’s 242 homes to view in Kansas City, Johnson County Kansas, Overland Park and the surrounding metropolitan area. The tour features some amazing floor plans and homes built by many of our areas top home builders and homes are located in communities across the metropolitan area.

It’s free to get in and view all of the nearly 250 homes on tour and most of the homes are open from 11am to 6pm daily during the tour schedule. View the Parade of homes books online and find more details about the homes tour at the Kansas City Home Builders site. If you’d like to line out your route for touring homes, here’s the online home search tool where you can locate homes by city, subdivision or price range!


Posted by Jason Brown

Add to DeliciousAdd to DiggAdd to FaceBookAdd to Google BookmarkAdd to RedditAdd to StumbleUponAdd to TechnoratiAdd to Twitter

Top 10 Hottest Home Sale Price Ranges In Johnson County Kansas

Checking The Pulse Of The Kansas City Real Estate Market

A common question we get from Johnson County Kansas home buyers is “What are the hottest price ranges in today’s real estate market?” The answer to this question is constantly changing and staying on top of such trends is one way we put our clients at an advantage in their real estate transactions. If you’re considering buying a home for personal use or as an investment, ask your real estate agent to fill you in on the hottest price ranges in your area of interest. This information could prove extremely beneficial in making a sound real estate decision.  


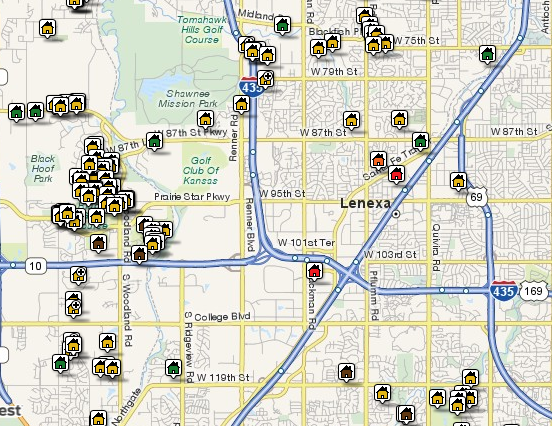
I’ve researched our local market stats by $25,000 increments to locate the most active price ranges the past 30 days in Johnson County Kansas. Here’s the top 10 price ranges listed by the most homes sold (closed)…

#1: $150,001 – $175,000 with 122 homes Sold.
#2: $125,001 – $150,000 with 113 homes Sold.
#3: $175,001 – $200,000 with 105 homes Sold.
#4: $225,001 – $250,000 with 82 homes Sold.
#5: $200,001 – $225,000 with 75 homes Sold.
#6: $100,001 – $125,000 with 65 homes Sold.
#7: $275,001 – $300,000 with 64 homes Sold.
#8: $250,001 – $275,000 with 56 homes Sold.
#9: $325,001 – $350,000 with 48 homes Sold.
#10: $300,001 – $325,000 with 41 homes Sold.

Posted by Jason Brown

Add to DeliciousAdd to DiggAdd to FaceBookAdd to Google BookmarkAdd to RedditAdd to StumbleUponAdd to TechnoratiAdd to Twitter

View Nearly 300 Homes On The Spring 2012 Kansas City Parade Of Homes Tour

Checking The Pulse Of The Kansas City Real Estate Market

The 2012 Kansas City Spring Parade of Homes tour is under way and about to enter its second weekend. There’s 287 homes on tour for potential home buyers to view in Kansas City, Johnson County Kansas, Overland Park and the surrounding areas. The Parade of Homes runs through Sunday April 29th, so there’s plenty of time to get out and see our area new home communities, new floor plans and the great home options made available by Kansas City’s best home builders.

There’s no cost to enter of the nearly 300 homes on tour and parade books are available at the Kansas City Home Builders Association location near I-435 and Holmes Road in Kansas City.  Or you can start planning your own route by using this online tool to search by city, subdivision and price range. Here’s an online copy of the Parade of Homes magazine, click on the magazine to start the slide show.  Finally, here’s a list of the some of the award-winning homes on the Kansas City Spring Parade of homes tour. Most of the homes on the tour are scheduled to be open from 11am to 6pm daily.

Posted by Jason Brown

Add to DeliciousAdd to DiggAdd to FaceBookAdd to Google BookmarkAdd to RedditAdd to StumbleUponAdd to TechnoratiAdd to Twitter

Search 20,000+ Homes For Sale In Kansas City, Johnson County KS, Overland Park And The Surrounding Area

Checking The Pulse Of The Kansas City Real Estate Market

Want to search all 20,000+ Kansas City homes for sale? Or do you just want to search the homes for sale in a specific price range, area or with other specific search parameters? You can do all that and, if you choose to, even save your favorites (for free) and come back later to login and view them! You can also set yourself up to receive automatic email updates whenever new homes for sale come on the market in Kansas City, Johnson County Kansas, Overland Park, Olathe, Lenexa, Leawood, Shawnee, Prairie Village and the surrounding areas — and YOU choose the search parameters that will trigger the system to send you an email notification.

Click Here To Start Search Kansas City Homes For Sale


Posted by Jason Brown

Add to DeliciousAdd to DiggAdd to FaceBookAdd to Google BookmarkAdd to RedditAdd to StumbleUponAdd to TechnoratiAdd to Twitter

Home Prices Show Signs Of Stabilizing In Kansas Despite Significant Drop In Volume Of Sales

Checking The Pulse Of The Kansas City Real Estate Market

The recent Kansas Association of Realtors (KAR) report on February’s real estate market indicates both the volume of home sales and average sales prices are trending down in the state. Overall in the state of Kansas, home sales (closings) fell 7.7% in February 2011 compared with February of 2010. This is vastly different from the 5% rise in average sales price we saw in last months’ report. Home prices did stabilize though and the 1.8% drop in sales prices was much improved after last month’s report which showed an 8% fall in home prices. Compared to the 5.2% national drop in home prices, Kansas appears much more stable than other U.S. markets.

There’s currently 11.7 months of inventory on the market in the state of Kansas, which is almost 1.5 months less than in last month’s report. Looking closely at our local market in Johnson County Kansas, 351 homes were sold (closed) in February. This was just slightly less than the 369 home sales in Johnson County in February 2010. Comparing this February’s sales rate  (adjusting for the short month) to the 3,786 Johnson County Kansas homes for sale, there’s 9.2 months of inventory available. This indicates a buyer’s real estate market in Johnson County Kansas and presents first time home buyers, move-up buyers and buyers considering a lateral move with an excellent opportunity to explore their options.

Posted by Jason A. Brown

Add to DeliciousAdd to DiggAdd to FaceBookAdd to Google BookmarkAdd to RedditAdd to StumbleUponAdd to TechnoratiAdd to Twitter

End Of First Time Home Buyer Tax Credit Taking Toll On Johnson County KS Real Estate Market

Checking The Pulse Of The Kansas City Real Estate Market

The Home Buyer Credit ended the last day of April and since that time everyone with a stake in the real estate industry has been holding their breath in hopes that home sales would remain solid. However I’ve been concerned the past several weeks as web traffic, foot traffic and home inquiries have slowed. It was going to take a full month of market stats for me to analyze and be able to compare how our post-tax credit real estate market was doing. Well, the end of May has come, I’ve analyzed the stats,and the results aren’t  pretty.


The number of single-family Johnson County homes that went under contract in May 2010 was down roughly 60% when compared to April 2010.  The raw numbers are 1,138 homes going under contract from 4/1/10 through 4/30/10, compared to 438 homes going under contract 5/1/10 through 5/31/10. These figures give a clear indication that the end of the Home Buyer Credit is really taking a toll on the Johnson County Kansas real estate market.

I wanted to take another angle and also compare May’s (post-tax credit) market stats against a month that didn’t involve the frantic buyers trying to get under contract prior to the end of tax credit in April. So I took a look at the Johnson County Kansas market stats for May 2009 and found  781 homes went under contract. Compare this to the 438 homes that just went under contract in May 2010 and you get a huge 44% drop in contracts written. It appears, at least in the near-term, that the post-tax credit real estate market could remain a tough one for Johnson County Kansas home sellers.


Posted by Jason A. Brown

A Home’s Beauty Is In The Eyes Of The Seller, Buyer, Lender, Independent Appraiser, County Tax Appraiser…

Hands On The Heartland
Checking The Pulse Of The Kansas City Real Estate Market

A common question that home sellers ask is “what’s my home worth?”. If you’ve followed my blog very long you’ll know that’s a question that neither a real estate agent nor an appraiser (tax appraisers certainly included) can answer. The truth is that the market determines what a seller’s home is worth. Taking that a step further, the price that a home goes under contract isn’t the value either. The home must close and only at that time will we know what the seller’s home is worth. If a buyer backs out of a deal because of inspections, the home isn’t worth what the previous buyer offered – because it never closed. The next buyer (after closing) will have determined the home’s value.

If a buyer should add $50,000 in upgrades the month after they move in, there home isn’t “worth” $75,000 more. It’s not even “worth” even $10,000 more. The point is that until the home sells again we won’t know what a home is worth. So the only time that anyone knows the true worth of a home is at the closing. What a Realtor can do however is study the area comparables (listings, pendings, sales, expireds, etc.) and help a seller to make an informed pricing decision based on a home’s condition, location and relevant market conditions. 

It’s interesting how sometimes a home can be viewed SO differently through different eyes… 

Seller’s View… 

Buyer’s View… 

Lender’s View… 

Independent Appraiser’s View… 

County Tax Appraiser’s View… 

Posted by Jason A. Brown

Comments Can Be Left Below…
Don’t see the LEAVE A COMMENT section below?
 
First click on the headline at the top of this bog post.

Johnson County Kansas Real Estate Update * 15 Days Of Johnson County KS Statistics

Hands On The Heartland
Checking The Pulse Of The Kansas City Real Estate Market

Johnson County Kansas Real Estate Update <> 15-day Glance:

Johnson County KS Real Estate Market Stats

Type

#

Average $

D.O.M.

Newest Listings

446

$309,815

View These Listings

Total Active Listings

3,883

Newest Pending

148

$240,211*

89

View These Pendings

Recently Sold (Closed)

124

$243,186

58

View These Solds

* Average Newest Pending considers the price the homes were listed at when they went under contract. Data pulled from Heartland MLS and deemed reliable but not guaranteed. Low samplings in any category can skew a particular category. DOM is Days On Market. Note the date of this post as market stats become outdated. Stats may not be an exact 15 days. Stats pulled AM on 2/4/09. 

Johnson County KS

Johnson County KS

In Johnson County Kansas there continues to be more homes coming on the market than homes going under contract (pending) or than homes being sold (closed). This creates a further surplus of supply. Using the past 15 days as a basis for figuring the absorption rate in Johnson County Kansas, there is about 15 and a half months of inventory on the market in Johnson County. 

Keep in mind that a 15-day period is a small sampling of market activity and designed to look at the what’s going on in the short term in our real estate market. While a 15-day period could indicate a trend it does not necessarily show a real estate markets long-term trend. For example, with the spring real estate market around the corner, if there were 250 sales in a 15-day period then it would calculate to about 8 months of inventory (under the assumption there’s the same number of listings on the market).

Posted by Jason A. Brown

Comments Can Be Left Below…
Don’t see the LEAVE A COMMENT section below? 
Click on the headline at the top of this blog post.