Lenexa Kansas Real Estate Market – November 2014 Update

The Pulse Of The Kansas City Real Estate Market

Lenexa Kansas Real Estate Update
Recent Real Estate Market Activity In Lenexa KS

Using the 19 homes sold in Lenexa Kansas the past 15 days to calculate the absorption rate in the city, we find there’s currently 5.7 months of inventory on the market. This amount of inventory indicates a buyer’s real estate market in the city of Lenexa. The average new listing the past 15 days came on the market around $284,000, while the average sales price during the same time period was around $268,000.

Type # Average $ Avg DOM
Listings Past 15 Days 38 $283,730
Total Active Listings 218
Newest Contracts Written 34 $269,354 88
Sold (closed) Past 15 Days 19 $267,882 118

* The Average $ of Newest Contracts Written considers the list price when the homes went under contract. Data pulled from Heartland MLS and deemed reliable but not guaranteed. Low samplings in a category can skew results. Stats cover approximately 15 days from post date. DOM = Days On Market.

The last 19 homes sold in Lenexa Kansas were on the market an average of 118 days, while the 34 homes to go under contract during the same time period did so in 88 days on average. We can assist you with buying or selling a home in Lenexa, so contact The Jason Brown Group with all of your area real estate needs. You can also start the process by finding detailed real estate information on our site regarding selling a Lenexa Kansas home and buying a Lenexa Kansas home.

Lenexa Kansas Real Estate Information

Search All Lenexa Kansas MLS Listings

View More Local Market Stats

Listing Agents In Lenexa Kansas

Buyer’s Agents In Lenexa Kansas

Posted by Jason Brown


Lenexa Kansas Real Estate Market – September 2014 Update

The Pulse Of The Kansas City Real Estate Market

Lenexa Kansas Real Estate Update
Recent Real Estate Market Activity In Lenexa KS

Using the 25 homes sold in Lenexa the past 15 days to calculate the absorption rate in the city, we find there’s currently 4.5 months of inventory on the market. This amount of inventory indicates a slight seller’s real estate market in the city of Lenexa. The average new listing the past 15 days came on the market around $312,000, while the average sales price during the same time period was around $250,000.

Type # Average $ Avg DOM
Listings Past 15 Days 45 $312,232
Total Active Listings 224
Newest Contracts Written 26 $310,384 67
Sold (closed) Past 15 Days 25 $249,697 87

* The Average $ of Newest Contracts Written considers the list price when the homes went under contract. Data pulled from Heartland MLS and deemed reliable but not guaranteed. Low samplings in a category can skew results. Stats cover approximately 15 days from post date. DOM = Days On Market.

The last 25 homes sold in Lenexa Kansas were on the market an average of 87 days, while the 26 homes to go under contract during the same time period did so in 67 days on average. We can assist you with buying or selling a home in Lenexa, so don’t hesitate to contact The Jason Brown Group with all of your Lenexa Kansas real estate questions. You can also start the process by finding detailed real estate information on our site regarding selling a Lenexa Kansas home and buying a Lenexa Kansas home.

Lenexa Kansas Real Estate Information

Search All Lenexa Kansas MLS Listings

View More Local Market Stats

Listing Agents In Lenexa Kansas

Buyer’s Agents In Lenexa Kansas

Posted by Jason Brown
 

Lenexa Kansas Real Estate Market Update – April 2014 Update

The Pulse Of The Kansas City Real Estate Market

Lenexa Kansas Real Estate Update
Recent Real Estate Market Activity In Lenexa KS

Using the 20 homes sold in Lenexa Kansas the past 15 days to calculate the absorption rate in the city, we find there’s currently 4.6 months of inventory on the market. This amount of inventory indicates a slight seller’s real estate market in the city of Lenexa. The average new listing the past 15 days came on the market around $351,000, while the average sales price during the same time period was around $283,000. 

Type # Average $ Avg DOM
Listings Past 15 Days 60 $351,899
Total Active Listings 182
Newest Contracts Written 46 $290,617 57
Sold (closed) Past 15 Days 20 $283,396 111

* The Average $ of Newest Contracts Written considers the list price when the homes went under contract. Data pulled from Heartland MLS and deemed reliable but not guaranteed. Low samplings in a category can skew results. Stats cover approximately 15 days from post date. DOM = Days On Market.

The last 20 homes sold in Lenexa were on the market an average of 111 days, while the 46 homes to go under contract during the same time period did so in 57 days on average. We can assist you with buying or selling a home in Lenexa, so please contact us with any questions you have about real estate in the area. You can also start the process with our detailed website regarding selling a Lenexa Kansas home and buying a Lenexa Kansas home.

Lenexa Kansas Real Estate Information

Search All Lenexa Kansas MLS Listings

View More Local Market Stats

Listing Agents In Lenexa Kansas

Buyer’s Agents In Lenexa Kansas

Posted by Jason Brown


Lenexa Kansas Real Estate Market Update – January 2014 Update

Checking The Pulse Of The Kansas City Real Estate Market

Lenexa Kansas Real Estate Update
Recent Real Estate Market Activity In Lenexa KS

Using the 14 homes sold in Lenexa Kansas the past 15 days to calculate the absorption rate in the city, we find there’s currently 6.4 months of inventory on the market. This amount of inventory indicates a balanced real estate market in the city of Lenexa. The average new listing the past 15 days came on the market around $268,000, while the average sales price during the same time period was around $202,000.

Type # Average $ Avg DOM
Listings Past 15 Days 21 $267,607
Total Active Listings 179
Newest Contracts Written 16 $239,703 83
Sold (closed) Past 15 Days 14 $201,658 126

* The Average $ of Newest Contracts Written considers the list price when the homes went under contract. Data pulled from Heartland MLS and deemed reliable but not guaranteed. Low samplings in a category can skew results. Stats cover approximately 15 days from post date. DOM = Days On Market.

The last 14 homes sold in Lenexa Kansas were on the market an average of 126 days. We can assist you with buying or selling a home in Lenexa, so please contact us with any questions you have about real estate in the area. You can also start the process by finding detailed real estate information on our site regarding selling a Lenexa Kansas home and buying a Lenexa Kansas home.

Lenexa Kansas Real Estate Information

Search All Lenexa Kansas MLS Listing

View More Local Market Stats

Listing Agents In Lenexa Kansas

Buyer’s Agents In Lenexa Kansas

Posted by Jason Brown


Lenexa Kansas Real Estate Market Update – November 2013 Update

Checking The Pulse Of The Kansas City Real Estate Market

Lenexa Kansas Real Estate Update
Recent Real Estate Market Activity In Lenexa KS

Using the 25 homes sold in Lenexa the past 15 days to calculate the absorption rate in the city, we find there’s currently 3.9 months of inventory on the market. This amount of inventory indicates a seller’s real estate market in the city of Lenexa Kansas. The average new listing the past 15 days came on the market around $253,000, while the average sales price during the same time period was around $291,000.

Type # Average $ Avg DOM
Listings Past 15 Days 38 $252,957
Total Active Listings 197
Newest Contracts Written 30 $254,494 66
Sold (closed) Past 15 Days 25 $291,091 72

* The Average $ of Newest Contracts Written considers the list price when the homes went under contract. Data pulled from Heartland MLS and deemed reliable but not guaranteed. Low samplings in a category can skew results. Stats cover approximately 15 days from post date. DOM = Days On Market.

The last 25 homes sold in Lenexa were on the market an average of 72 days and the last 30 homes to go under contract were on the market and average of 66 days. We can assist you with buying or selling a home in Lenexa, so please contact us with any questions you have about real estate in the Lenexa Kansas area. You can also start the process by finding detailed real estate information on our site regarding selling a Lenexa Kansas home and buying a Lenexa Kansas home.

Lenexa Kansas Real Estate Information

Search All Lenexa Kansas MLS Listing

View More Local Market Stats

Listing Agents In Lenexa Kansas

Buyer’s Agents In Lenexa Kansas

Posted by Jason Brown


Lenexa Kansas Real Estate Market Update – September 2013 Update

Checking The Pulse Of The Kansas City Real Estate Market

Lenexa Kansas Real Estate Update
Recent Real Estate Market Activity In Lenexa KS

Using the 26 homes sold in Lenexa the past 15 days to calculate the absorption rate in the city, we find there’s currently 3.9 months of inventory on the market. This amount of inventory indicates a seller’s real estate market in the city of Lenexa. The average new listing the past 15 days came on the market around $325,000, while the average sales price during the same time period was around $309,000.

Type # Average $ Avg DOM
Listings Past 15 Days 48 $324,590
Total Active Listings 205
Newest Contracts Written 41 $251,315 49
Sold (closed) Past 15 Days 26 $309,326 87

* The Average $ of Newest Contracts Written considers the list price when the homes went under contract. Data pulled from Heartland MLS and deemed reliable but not guaranteed. Low samplings in a category can skew results. Stats cover approximately 15 days from post date. DOM = Days On Market.

The last 26 homes sold in Lenexa were on the market an average of 87 days and the last 41 homes to go under contract were on the market an average of 49 days. We can assist you with buying or selling a home in Lenexa, so please contact us with any questions you have about real estate in the area. If you’re just starting the process, you can find detailed real estate information on our site regarding selling a Lenexa Kansas home and buying a Lenexa Kansas home.

Lenexa Kansas Real Estate Information

Search All Lenexa Kansas MLS Listing

View More Local Market Stats

Listing Agents In Lenexa Kansas

Buyer’s Agents In Lenexa Kansas

Posted by Jason Brown


Use Our Mapping Feature To Search Homes For Sale Via The Kansas City MLS

Checking The Pulse Of The Kansas City Real Estate Market

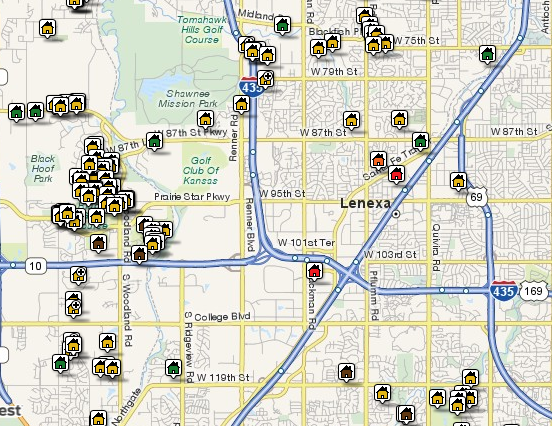
Search area homes for sale using mapping features of listings fed from the Kansas City MLS. Locate homes currently for sale in Kansas City, Johnson County Kansas, Overland Park, Olathe, Lenexa, Leawood, Shawnee and the surrounding metro areas! Click the map below to get started…

Photo 1244


Posted by Jason Brown

Lenexa Kansas Real Estate Market Update – April 2013 Update

Checking The Pulse Of The Kansas City Real Estate Market

Lenexa Kansas Real Estate Update
Recent Real Estate Market Activity In Lenexa KS

Looking at the past 15 days of real estate sales activity in the city of Lenexa Kansas and comparing it to the current volume of homes for sale in Lenexa, we find there’s 2.8 months of inventory on the market. This amount of inventory indicates a seller’s real estate market in the city of Lenexa and it’s the lowest volume of inventory I’ve seen in the city in many years. The average new listing the past 15 days came on the market around $334,000, while the average sales price over the same period was around $264,000.

Type # Average $ Avg DOM
Listings Past 15 Days 37 $333,511
Total Active Listings 143
Newest Contracts Written 40 $255,560 76
Sold (closed) Past 15 Days 26 $264,433 120

* The Average $ of Newest Contracts Written considers the list price when the homes went under contract. Data pulled from Heartland MLS and deemed reliable but not guaranteed. Low samplings in a category can skew results. Stats cover approximately 15 days from post date. DOM = Days On Market.

The last 26 homes sold in Lenexa were on the market an average of 120 days. If you are looking to buy or sell a home in Lenexa and have questions about the area or market stats, please contact us for assistance. You can also find detailed information on our website regarding selling a Lenexa Kansas home and buying a Lenexa Kansas home.

Lenexa Kansas Real Estate Information

Search All Lenexa Kansas MLS Listing

View More Local Market Stats

Listing Agents In Lenexa Kansas

Buyer’s Agents In Lenexa Kansas

Posted by Jason Brown


Lenexa Kansas Real Estate Market Stats – October 2012 Update

Checking The Pulse Of The Kansas City Real Estate Market

Lenexa Kansas Real Estate Update
Recent Real Estate Activity In Lenexa KS

Using the past 15 days of real estate sales activity in Lenexa Kansas to calculate the city’s absorption rate, we find there’s 6.1 months of inventory currently on the market. This amount of inventory is considered a balanced real estate market in the city of Lenexa. The homes sold (closed) in Lenexa the past 15 days had an average sales price of more than $254,000, while the average new listing came on the market at more than $279,000.

Type # Average $ Avg DOM
Listings Past 15 Days 33 $279,311
Total Active Listings 207
Newest Contracts Written 24 $249,035 134
Sold (closed) Past 15 Days 17 $254,225 68

* The Average $ of Newest Contracts Written considers the list price when the homes went under contract. Data pulled from Heartland MLS and deemed reliable but not guaranteed. Low samplings in a category can skew results. Stats cover approximately 15 days from post date. DOM = Days On Market.

The last 17 homes sold in Lenexa Kansas were on the market an average of 68 days. If you’re in the market to buy or sell a home in Lenexa Kansas, my real estate group can help you through the process. Get  details here regarding selling a Lenexa Kansas home and with buying a Lenexa Kansas home. If you have specific questions, please contact us for assistance.

Lenexa Kansas Relocation Guide

View Homes For Sale In Lenexa KS

View More Lenexa KS Real Estate Stats

Buyer’s Agents In Lenexa KS

Listing Agents In Lenexa KS


Posted by Jason Brown

Add to DeliciousAdd to DiggAdd to FaceBookAdd to Google BookmarkAdd to RedditAdd to StumbleUponAdd to TechnoratiAdd to Twitter

View Nearly 250 Homes On The Fall 2012 Kansas City Parade Of Homes Tour

Checking The Pulse Of The Kansas City Real Estate Market

The Fall of 2012 Kansas City Parade of Homes tour begins tomorrow, Saturday 9/29. The Parade of Homes runs through Sunday October 14th this year and there’s 242 homes to view in Kansas City, Johnson County Kansas, Overland Park and the surrounding metropolitan area. The tour features some amazing floor plans and homes built by many of our areas top home builders and homes are located in communities across the metropolitan area.

It’s free to get in and view all of the nearly 250 homes on tour and most of the homes are open from 11am to 6pm daily during the tour schedule. View the Parade of homes books online and find more details about the homes tour at the Kansas City Home Builders site. If you’d like to line out your route for touring homes, here’s the online home search tool where you can locate homes by city, subdivision or price range!


Posted by Jason Brown

Add to DeliciousAdd to DiggAdd to FaceBookAdd to Google BookmarkAdd to RedditAdd to StumbleUponAdd to TechnoratiAdd to Twitter