Hot Kansas City Real Estate Market Continues through 2nd Quarter of 2016

The Jason Brown Group

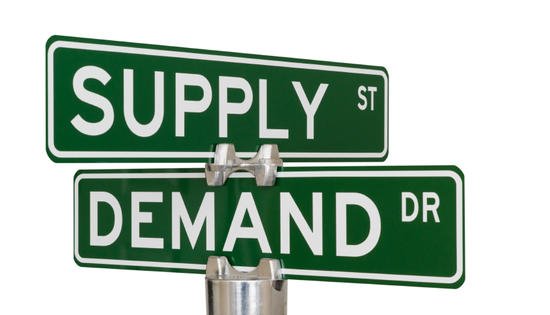
During the 2nd quarter of 2016, the volume of home sales has continued to rise and home sales prices have followed. As it has for around a year now, the supply of homes for sale is failing to meet the buyer demand for homes. Not only has supply not started to correct itself, the volume of inventory has continues to go down while the demand for homes has remained on the rise.

2032

Kansas City area home sellers continue to obtain a very high percentage of their asking price with most obtaining 98% to 100%+ of asking price. Closings in the metro area rose 4.9% in the 2nd quarter with 11,605 home sales this year compared to 11,065 2nd quarter of last year. There were 8,582 homes for sale during the 2nd quarter this year and that’s a huge drop from the 11,894 homes for sale at this time last year… And compared to 4 years, listings are down an incredible 40%!

Overall in the Kansas City metro area, there’s 2.8 months of inventory on the market. That volume of inventory indicates a Seller’s real estate market. At this time last year there was 4.2 months available and while that’s still a seller’s market, it’s a much stronger seller’s market right now. And 3 years ago there was 5.7 months of inventory and that amount of inventory represented a balanced real estate market. Essentially we have about HALF the number of homes available for home buyers as we did a few years ago. This is a major reason home sellers have obtained an average sales price of $186,000 metro wide, which is $10,000 higher than 2nd quarter a year ago.

The current hot summer real estate market looks very much like it will continue right into the fall, and possibly all the way through it. But there’s also a lot going in the world that could change things… And interest rates are sure to rise at some point. The election year has historically played a role in the direction of the real estate market and nobody knows for sure just how that’s going to turn out. For now, we remain in a very fast paced market. If you’re thinking about making a move, give me a call to discuss the effects our current market have on your home buying and home selling decisions.


Search Area Homes For Sale!

Posted by Jason Brown


Lenexa KS real estate update for August 2016… Get details on the strong Seller’s market & search Lenexa homes for sale

The Jason Brown Group

Lenexa KS Real Estate Update

There were 49 homes sold (closed) in Lenexa Kansas the past 15 days. Comparing this sales rate to the current 193 homes for sale in Lenexa, the city has 2.0 months of inventory on the market. This volume of real estate inventory indicates a strong seller’s real estate market in Lenexa. The average new listing the past 15 days in Lenexa Kansas came on the market around a $310,000 list price, while the average sales price during the same time frame was nearly $331,000.

Type # Average $ Avg DOM
Listings Past 15 Days 54 $310,321
Total Active Listings 193
Newest Contracts Written 51 $310,569 46
Sold (closed) Past 15 Days 49 $331,037 71

* The Average $ of Newest Contracts Written considers the list price when the homes went under contract. Data pulled from Heartland MLS and deemed reliable but not guaranteed. Low samplings in a category can skew results. Stats cover approximately 15 days from post date. DOM = Days On Market.

The last 49 homes sold in Lenexa Kansas were on the market an average of 71 days, while the last 51 homes to go under contract did so in 46 days on average. We look forward to helping you assess the effect these market stats have on your your real estate investment and the decisions you make when buying or selling a Lenexa Kansas home.

The Jason Brown Group gives Lenexa home sellers powerful representation and we get our average listing sold within 60 days and for more than 98% of list price. We represent Lenexa home buyer’s best interests throughout the home buying process and help with locating all area homes for sale that fit our buyer’s needs. Get an overview of how we will assist you in selling a Lenexa Kansas home or buying a Lenexa Kansas home and contact us for personal real estate assistance.

Lenexa KS Real Estate Info

View All Lenexa Homes For Sale

Additional Real Estate Market Stats

Lenexa area Listing Agents

Lenexa area Buyer’s Agents

Posted by Jason Brown


Lenexa KS real estate update for July 2016… Get details on the Seller’s market & search Lenexa homes for sale

The Jason Brown Group

Lenexa KS Real Estate Update

There were 39 homes sold (closed) in Lenexa Kansas the past 15 days. Comparing this sales rate to the current 186 homes for sale in Lenexa, the city has 2.4 months of inventory on the market. This volume of real estate inventory indicates a seller’s real estate market in Lenexa. The average new listing the past 15 days in Lenexa Kansas came on the market around a $382,000 list price, while the average sales price during the same time frame was nearly $294,000.

Type # Average $ Avg DOM
Listings Past 15 Days 45 $382,495
Total Active Listings 186
Newest Contracts Written 35 $297,406 54
Sold (closed) Past 15 Days 39 $294,316 66

* The Average $ of Newest Contracts Written considers the list price when the homes went under contract. Data pulled from Heartland MLS and deemed reliable but not guaranteed. Low samplings in a category can skew results. Stats cover approximately 15 days from post date. DOM = Days On Market.

The last 39 homes sold in Lenexa Kansas were on the market an average of 66 days, while the last 35 homes to go under contract did so in 54 days on average. We look forward to helping you assess the effect these market stats have on your your real estate investment and the decisions you make when buying or selling a Lenexa Kansas home.

The Jason Brown Group gives Lenexa home sellers powerful representation and we get our average listing sold within 60 days and for more than 98% of list price. We represent Lenexa home buyer’s best interests throughout the home buying process and help with locating all area homes for sale that fit our buyer’s needs. Get an overview of how we will assist you in selling a Lenexa Kansas home or buying a Lenexa Kansas home and contact us for personal real estate assistance.

Lenexa KS Real Estate Information

View Lenexa Homes For Sale

Additional Real Estate Market Stats

Lenexa Kansas Listing Agents

Lenexa Kansas Buyer’s Agents

Posted by Jason Brown


If You’re In The Market To Sell Your Home, You’ll Want To List With The #1 Real Estate Office In Johnson County KS

The Jason Brown Group

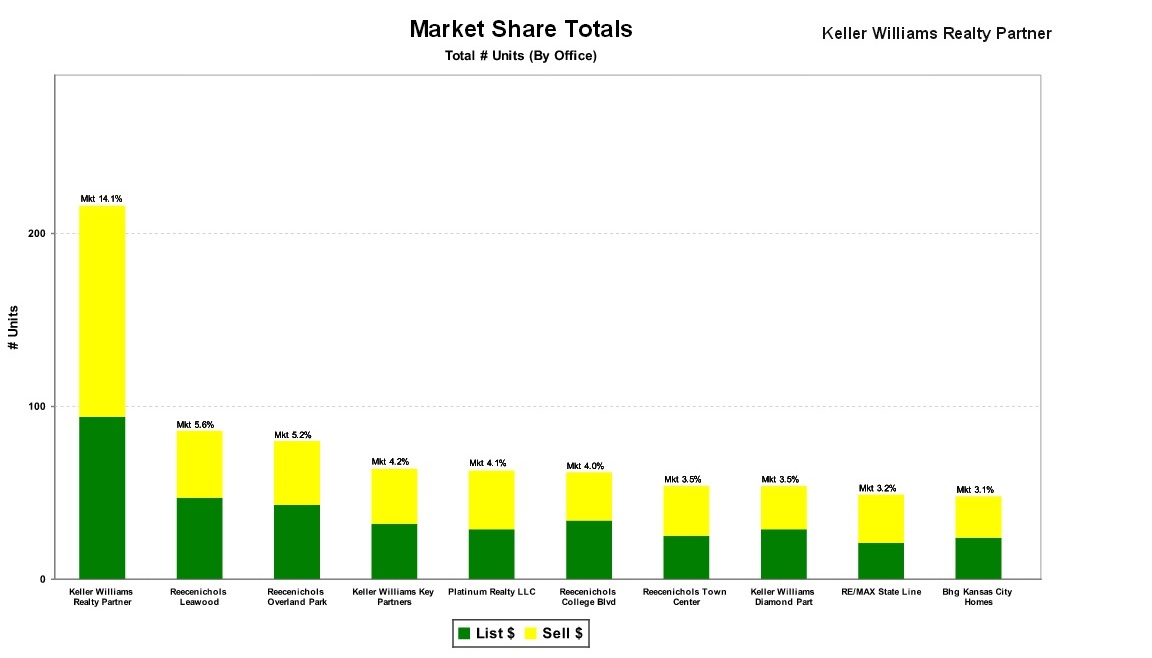
My Overland Park Keller Williams office SOLD double the number of homes in December as the #2 office in Johnson County Kansas. If you’re in the market to sell your home, list it with an office that sold $24 million in real estate in December — that’s $10 million MORE sold than the next closest Johnson County Kansas real estate office. This includes all offices within all brokerages, including Keller Williams, Reece and Nichols, Re/Max, Platinum, Better Homes Gardens offices, etc.

Temp
Over the past decade, The Jason Brown Group has sold our average listing within 60 days and for 98% of list price. We’re in the best seller’s market we’ve seen in years and we can help you get your home sold QUICKLY, for the MOST MONEY and we will make it EASY on you every step of the way! Call (913-915-6008) or email (jasonbrown@kw.com) us today, we look forward to discussing getting your home SOLD!

Search Area Homes For Sale

Posted by Jason Brown


Lenexa Kansas real estate update for January 2016… View the Seller’s market breakdown & Lenexa homes for sale

The Jason Brown Group

Lenexa KS Real Estate Update

There were 51 homes sold (closed) in Lenexa Kansas the past 15 days. Comparing this sales rate to the current 161 homes for sale in Lenexa, the city has 1.6 months of inventory on the market. This volume of real estate inventory indicates a strong seller’s real estate market in Lenexa. The average new listing the past 15 days in Lenexa Kansas came on the market around a $299,000 list price, while the average sales price during the same time frame was around $295,000.

Type # Average $ Avg DOM
Listings Past 15 Days 66 $370,238
Total Active Listings 161
Newest Contracts Written 37 $298,983 58
Sold (closed) Past 15 Days 51 $295,451 71

* The Average $ of Newest Contracts Written considers the list price when the homes went under contract. Data pulled from Heartland MLS and deemed reliable but not guaranteed. Low samplings in a category can skew results. Stats cover approximately 15 days from post date. DOM = Days On Market.

The last 51 homes sold in Lenexa Kansas were on the market an average of 71 days, while the last 37 homes to go under contract did so in 58 days on average. We can help you further assess these Lenexa real estate market stats and we look forward to assisting you with buying or selling a Lenexa Kansas home.

We give Lenexa Kansas home sellers powerful representation and we get our average listing sold within 60 days and for more than 98% of list price. We represent Lenexa home buyer’s best interests throughout the home buying process and help with locating all the possible area homes that fit our buyer’s needs. Get detailed information on our site regarding selling a Lenexa Kansas home or buying a Lenexa Kansas home and contact us when it’s time to start the real estate process.

Lenexa Real Estate Information

View All Lenexa Homes For Sale

Additional Real Estate Market Stats

Lenexa Listing Agents

Lenexa Buyer’s Agents

Posted by Jason Brown


Lenexa Kansas Real Estate Market – August 2014 Update

The Pulse Of The Kansas City Real Estate Market

Lenexa Kansas Real Estate Update
Recent Real Estate Market Activity In Lenexa KS

Using the 33 homes sold in Lenexa Kansas the past 15 days to calculate the absorption rate in the city, we find there’s currently 3.2 months of inventory on the market. This amount of inventory indicates a seller’s real estate market in the city of Lenexa Kansas. The average new listing the past 15 days came on the market around $282,000, while the average sales price during the same time period was around $292,000.

Type # Average $ Avg DOM
Listings Past 15 Days 40 $281,638
Total Active Listings 209
Newest Contracts Written 32 $258,386 46
Sold (closed) Past 15 Days 33 $291,282 64

* The Average $ of Newest Contracts Written considers the list price when the homes went under contract. Data pulled from Heartland MLS and deemed reliable but not guaranteed. Low samplings in a category can skew results. Stats cover approximately 15 days from post date. DOM = Days On Market.

The last 33 homes sold in Lenexa Kansas were on the market an average of 64 days, while the 32 homes to go under contract during the same time period did so in 46 days on average. We can assist you with buying or selling a home in Lenexa Kansas, so please contact The Jason Brown Group with all of your Lenexa Kansas real estate questions. You can also start the process by finding detailed real estate information on our site regarding selling a Lenexa Kansas home and buying a Lenexa Kansas home.

Lenexa Kansas Real Estate Information

Search All Lenexa Kansas MLS Listings

View More Local Market Stats

Listing Agents In Lenexa Kansas

Buyer’s Agents In Lenexa Kansas

Posted by Jason Brown


Kansas Real Estate Market Remains Solid As We Head Into The Holiday Season

Checking The Pulse Of The Kansas City Real Estate Market


The recently released Kansas Association of Realtor real estate market stats (covering October home sales activity) show a continued strengthening of the housing market in Kansas. Compared to last October, home sales volume increased 3.5%. This follows up last month’s 15.5% increase in home sales volume.

Photo 1552

The state of Kansas is in a balanced real estate market for the second month in a row with 5.5 months of inventory on the market. This is up from the 5.3 months of inventory last month month. The average home sale price in Kansas rose 8.4% in comparison to October of last year and this matches last month’s 8.4% increase. Home sales volume has increased every month-over-month for more than two years. 

Locally in the Johnson County Kansas, a seller’s real estate market continues with 739 homes sold (closed) during the past month. Factored against the current volume of homes for sale in Johnson County Kansas, there’s 3.0 months of inventory currently for sale. This amount of inventory indicates the presence of a strong seller’s market as we head into the holiday season.

SEARCH HOMES FOR SALE IN KANSAS CITY, JOHNSON COUNTY KS AND THE SURROUNDING AREAS


Posted by Jason Brown

Add to DeliciousAdd to DiggAdd to FaceBookAdd to Google BookmarkAdd to RedditAdd to StumbleUponAdd to TechnoratiAdd to Twitter

Seller’s Real Estate Market Gaining Steam In Johnson County Kansas And State-Wide

Checking The Pulse Of The Kansas City Real Estate Market


The most recently released Kansas Association of Realtors real estate market stats (covering June) show a continued strengthening of the Kansas housing market. Both home sales volume and home sales price continued to rise in June. Home sales increased 5.5% compared during the month, which follows up a 14.2% jump in home sales the prior month.

Sel

The stats released a month ago showed the state of Kansas had moved into a sellers market for the first time since the market downturn years ago (with 4.0 months of inventory on the market). This update shows a continued solid seller’s market in Kansas with 4.3 months of inventory currently for sale. Home sales price rose 4.9% compared to June of last year and that follows up a 9.5% increase at last month’s update.

The Johnson County Kansas seller’s real estate market also continues with 975 homes sold (closed) the past month. Factored against the current volume of homes for sale in Johnson County Kansas, there’s 2.4 months of inventory on the market. At last month’s check Johnson County KS had 2.6 months of inventory, thus indicating a further strengthening of the seller’s market present in Johnson County Kansas.


Posted by Jason Brown

Add to DeliciousAdd to DiggAdd to FaceBookAdd to Google BookmarkAdd to RedditAdd to StumbleUponAdd to TechnoratiAdd to Twitter

Lenexa Kansas Real Estate Market Update – August 2013 Update

Checking The Pulse Of The Kansas City Real Estate Market

Lenexa Kansas Real Estate Update
Recent Real Estate Market Activity In Lenexa KS

Using the 32 homes sold in Lenexa Kansas the past 15 days to calculate the absorption rate in the city, we find there’s currently 3.3 months of inventory on the market. This amount of inventory indicates a seller’s real estate market in the city of Lenexa. The average new listing the past 15 days came on the market around $222,000, while the average sales price during the same time period was around $266,000.

Type # Average $ Avg DOM
Listings Past 15 Days 42 $221,772
Total Active Listings 209
Newest Contracts Written 39 $247,816 72
Sold (closed) Past 15 Days 32 $265,893 85

* The Average $ of Newest Contracts Written considers the list price when the homes went under contract. Data pulled from Heartland MLS and deemed reliable but not guaranteed. Low samplings in a category can skew results. Stats cover approximately 15 days from post date. DOM = Days On Market.

The last 32 homes sold in Lenexa were on the market an average of 85 days. We can assist you with buying or selling a home in Lenexa, so please contact us with any questions you have regarding Lenexa Kansas real estate. If you’re in the early stages of the process, you can find detailed real estate information on our site regarding selling a Lenexa Kansas home or buying a Lenexa Kansas home.

Lenexa Kansas Real Estate Information

Search All Lenexa Kansas MLS Listing

View More Local Market Stats

Listing Agents In Lenexa Kansas

Buyer’s Agents In Lenexa Kansas

Posted by Jason Brown


Home Sale Prices And Volume Of Sales In Kansas Continues To Favor Home Sellers

Checking The Pulse Of The Kansas City Real Estate Market


The most recent Kansas Association of Realtors real estate stats (for the month of May) indicates further strengthening of the state-wide housing market. Home sales volume continue to rise, as does resulting home sale prices. During the month of May in Kansas, homes sales increased 14.2% compared to May of last year. This follows up last months reported 7.8% increase in home sales.

Photo 1562

At last months check, the state was in a balanced real estate market but nearing a seller’s market (with 5.2 months of inventory). This month there is 4.0 months of inventory on the market and thus the state  has moved into a seller’s market. The rise in home sale prices was just as impressive with average sale prices rising 9.5% compared to May of last year. This follows up last month’s huge 13.7% increase in sale prices in Kansas.

Locally in the Johnson County Kansas area, the real estate market continues to heavily favor home sellers. Over the past month there were 933 homes sold (closed) and comparing this sales rate against the current volume of homes for sale, it calculates to 2.6 months of inventory on the market. This is an increase over last month’s 2.1 months of inventory but still represents a very strong seller’s real estate market in Johnson County Kansas.


Posted by Jason Brown

Add to DeliciousAdd to DiggAdd to FaceBookAdd to Google BookmarkAdd to RedditAdd to StumbleUponAdd to TechnoratiAdd to Twitter