Overland Park Kansas Real Estate Market – February 2015 Update

The Pulse Of The Kansas City Real Estate Market

Overland Park Kansas Real Estate Update
Recent Real Estate Market Activity In Overland Park KS

Using the 30 homes sold in Overland Park Kansas the past 15 days to calculate the absorption rate in the city, we find there’s currently 8.9 months of inventory on the market. This amount of inventory indicates a buyer’s real estate market in the city of Overland Park. The average new listing the past 15 days came on the market around $324,000, while the average sales price during the same time period was around $376,000.

Type # Average $ Avg DOM
Listings Past 15 Days 156 $323,593
Total Active Listings 536
Newest Contracts Written 150 $285,534 63
Sold (closed) Past 15 Days 30 $376,142 82

* The Average $ of Newest Contracts Written considers the list price when the homes went under contract. Data pulled from Heartland MLS and deemed reliable but not guaranteed. Low samplings in a category can skew results. Stats cover approximately 15 days from post date. DOM = Days On Market.

The last 30 homes sold in Overland Park Kansas were on the market an average of 82 days, while the 150 homes to go under contract during the same time period did so in 63 days on average. We can assist you with buying or selling a home in Overland Park, so contact The Jason Brown Group with all of your area real estate questions. You can also start the process by finding detailed real estate information on our site regarding selling an Overland Park Kansas home and buying an Overland Park Kansas home.

Overland Park Kansas Real Estate Information

Search All Overland Park Kansas MLS Listings

View More Local Market Stats

Listing Agents In Overland Park Kansas

Buyer’s Agents In Overland Park Kansas

Posted by Jason Brown


Overland Park Kansas Real Estate Market – June 2014 Update

The Pulse Of The Kansas City Real Estate Market

Overland Park Kansas Real Estate Update
Recent Real Estate Market Activity In Overland Park KS

Using the 147 homes sold in Overland Park the past 15 days to calculate the absorption rate in the city, we find there’s currently 2.3 months of inventory on the market. This amount of inventory indicates a seller’s real estate market in the city of Overland Park Kansas. The average new listing the past 15 days came on the market around $333,000, while the average sales price during the same time period was around $298,000.

Type # Average $ Avg DOM
Listings Past 15 Days 212 $333,029
Total Active Listings 678
Newest Contracts Written 180 $306,184 43
Sold (closed) Past 15 Days 147 $298,422 68

* The Average $ of Newest Contracts Written considers the list price when the homes went under contract. Data pulled from Heartland MLS and deemed reliable but not guaranteed. Low samplings in a category can skew results. Stats cover approximately 15 days from post date. DOM = Days On Market.

The last 147 homes sold in Overland Park were on the market an average of 68 days, while the 180 homes to go under contract during the same time period did so in 43 days on average. We can assist you with buying or selling a home in Overland Park, so please contact The Jason Brown Group with all of your Overland Park Kansas real estate questions. You can also start the process by finding detailed real estate information on our site regarding selling an Overland Park Kansas home and buying an Overland Park Kansas home.

Overland Park Kansas Real Estate Information

Search All Overland Park Kansas MLS Listings

View More Local Market Stats

Listing Agents In Overland Park Kansas

Buyer’s Agents In Overland Park Kansas

Posted by Jason Brown
 

Overland Park Kansas Real Estate Market Update – April 2014 Update

The Pulse Of The Kansas City Real Estate Market

Overland Park Kansas Real Estate Update
Recent Real Estate Market Activity In Overland Park KS

Using the 74 homes sold in Overland Park Kansas the past 15 days to calculate the absorption rate in the city, we find there’s currently 3.5 months of inventory on the market. This amount of inventory indicates a seller’s real estate market in the city of Overland Park Kansas. The average new listing the past 15 days came on the market around $321,000, while the average sales price during the same time period was around $271,000.

Type # Average $ Avg DOM
Listings Past 15 Days 187 $321,338
Total Active Listings 520
Newest Contracts Written 189 $278,691 66
Sold (closed) Past 15 Days 74 $270,653 65

* The Average $ of Newest Contracts Written considers the list price when the homes went under contract. Data pulled from Heartland MLS and deemed reliable but not guaranteed. Low samplings in a category can skew results. Stats cover approximately 15 days from post date. DOM = Days On Market.

The last 74 homes sold in Overland Park were on the market an average of 65 days and the last 189 homes to go under contract were on the market 66 days on average. The Jason Brown Group can assist you with buying or selling a home in Overland Park Kansas, so please contact us with any questions you have. You can also start the process by finding detailed real estate information on our site regarding selling an Overland Park Kansas home or buying an Overland Park Kansas home.

Overland Park Kansas Real Estate Information

Search All Overland Park Kansas MLS Listings

View More Local Market Stats

Listing Agents In Overland Park Kansas

Buyer’s Agents In Overland Park Kansas

Posted by Jason Brown


Overland Park Kansas Real Estate Market Update – November 2013 Update

Checking The Pulse Of The Kansas City Real Estate Market

Overland Park Kansas Real Estate Update
Recent Real Estate Market Activity In Overland Park KS

Using the 72 homes sold (closed) in Overland Park the past 15 days to calculate the absorption rate in the city, we find there’s currently 3.9 months of inventory on the market. This amount of inventory indicates a seller’s real estate market in the city of Overland Park. The average new listing the past 15 days came on the market around $256,000, while the average sales price during the same time period was around $297,000.

Type # Average $ Avg DOM
Listings Past 15 Days 102 $255,578
Total Active Listings 571
Newest Contracts Written 102 $252,955 61
Sold (closed) Past 15 Days 72 $297,134 70

* The Average $ of Newest Contracts Written considers the list price when the homes went under contract. Data pulled from Heartland MLS and deemed reliable but not guaranteed. Low samplings in a category can skew results. Stats cover approximately 15 days from post date. DOM = Days On Market.

The last 72 homes sold in Overland Park were on the market an average of 70 days, while the last 102 homes to go under contract did so in an even quicker 61 days on average. We can assist you with buying or selling a home in Overland Park, so please contact us with any questions you have about Overland Park Real Estate. You can find detailed real estate information on our site regarding selling an Overland Park Kansas home and buying an Overland Park Kansas home.

Overland Park Kansas Real Estate Information

Search All Overland Park Kansas MLS Listing

View More Local Market Stats

Listing Agents In Overland Park Kansas

Buyer’s Agents In Overland Park Kansas

Posted by Jason Brown


Overland Park Kansas Real Estate Market Update – October 2013 Update

Checking The Pulse Of The Kansas City Real Estate Market

Overland Park Kansas Real Estate Update
Recent Real Estate Market Activity In Overland Park KS

Using the 109 homes sold in Overland Park the past 15 days to calculate the absorption rate in the city, we find there’s currently 2.8 months of inventory on the market. This amount of inventory indicates a seller’s real estate market in the city of Overland Park. The average new listing the past 15 days came on the market around $287,000, while the average sales price during the same time period was around $270,000.

Type # Average $ Avg DOM
Listings Past 15 Days 147 $287,123
Total Active Listings 617
Newest Contracts Written 117 $264,559 61
Sold (closed) Past 15 Days 109 $269,980 57

* The Average $ of Newest Contracts Written considers the list price when the homes went under contract. Data pulled from Heartland MLS and deemed reliable but not guaranteed. Low samplings in a category can skew results. Stats cover approximately 15 days from post date. DOM = Days On Market.

The last 109 homes sold in Overland Park were on the market an average of 57 days. We can assist you with buying or selling a home in Overland Park, so please contact us with any questions you have about Overland Park real estate. You can also start the process by finding detailed real estate information on our site regarding selling an Overland Park Kansas home or buying an Overland Park Kansas home.

Overland Park Kansas Real Estate Information

Search All Overland Park Kansas MLS Listing

View More Local Market Stats

Listing Agents In Overland Park Kansas

Buyer’s Agents In Overland Park Kansas

Posted by Jason Brown


Overland Park Kansas Real Estate Market Update – June 2013 Update

Checking The Pulse Of The Kansas City Real Estate Market

Overland Park Kansas Real Estate Update
Recent Real Estate Market Activity In Overland Park KS

Comparing the past 15 days of real estate sales activity in Overland Park Kansas to the current volume of homes for sale in the city, we find there’s 1.9 months of inventory. This amount of inventory indicates a strong seller’s real estate market in the city of Overland Park. The average new listing the past 15 days came on the market around $297,000, while the average sales price during the same period was around $270,000.

Type # Average $ Avg DOM
Listings Past 15 Days 242 $297,275
Total Active Listings 599
Newest Contracts Written 192 $263,134 50
Sold (closed) Past 15 Days 156 $270,239 61

* The Average $ of Newest Contracts Written considers the list price when the homes went under contract. Data pulled from Heartland MLS and deemed reliable but not guaranteed. Low samplings in a category can skew results. Stats cover approximately 15 days from post date. DOM = Days On Market.

The last 156 homes sold in Overland Park Kansas were on the market an average of 61 days. If you’re considering buying or selling a home in Overland Park, Kansas, we can help you through the process. Please contact us with any real estate questions you may have and you can start the real estate process by finding a wealth of real estate info on our site regarding selling an Overland Park Kansas home and buying an Overland Park Kansas home.

Overland Park Kansas Real Estate Information

Search All Overland Park Kansas MLS Listing

View More Local Market Stats

Listing Agents In Overland Park Kansas

Buyer’s Agents In Overland Park Kansas

Posted by Jason Brown


Top 10 Hottest Selling Home Communities In Johnson County Kansas

Checking The Pulse Of The Kansas City Real Estate Market

When buying a home in Johnson County Kansas, most buyers aren’t simply looking for the perfect home. Home buyers are also looking to make the best possible real estate investment decisions. Smart buyers are willing to give in to some of their wants, focus more on what they really need and then find the best possible home in one of our areas best selling communities. If there’s a chance you may need to sell your home within a few years of buying, here’s a good starting point, with the 10 hottest selling home communities in Johnson County Kansas so far in 2013 (ranked by homes sold)

1. Havencroft in Olathe KS (32 homes sold, $160’s average sales price)

2. Cedar Creek in Olathe KS (30 homes sold, $440’s average sales price)

3. Bluestem in Overland Park KS (28 homes sold, $510’s average sales price)

4. Prairie Fields in Prairie Village KS (27 homes sold, $160’s average sales price)

5. Leawood Estates in Leawood KS (25 homes sold, $360’s average sales price)

6. Forest View in Olathe KS (23 homes sold, $410’s average sales price)

7 Oak Park in Overland Park (23 homes sold, $170’s average sales price)

8. Prairie Point in Olathe KS (19 homes sold, $370’s average sales price)

9. Leawood South in Leawood KS (18 homes sold, $300’s average sales price)

10. Wyngate in Overland Park KS (17 homes sold, $460’s average sales price)

Just out of the top 10: Lionsgate, The Reserve, Hampton Place, Nottingham By The Green

SEARCH ALL JOHNSON COUNTY KS HOMES FOR SALE


Posted by Jason Brown

Overland Park Kansas Real Estate Market Update – May 2013 Update

Checking The Pulse Of The Kansas City Real Estate Market

Overland Park Kansas Real Estate Update
Recent Real Estate Market Activity In Overland Park KS

Looking at the past 15 days of real estate sales activity in the city of Overland Park Kansas and comparing it to the current volume of homes for sale in the city, calculates to 2.9 months of inventory for sale. This amount of inventory indicates a solid seller’s real estate market in the city of Overland Park. The average sales price the past 15 days was nearly $277,000, while the average new listing came on the market around $287,000 during the same time period.

Type # Average $ Avg DOM
Listings Past 15 Days 201 $287,027
Total Active Listings 562
Newest Contracts Written 184 $276,072 54
Sold (closed) Past 15 Days 96 $276,560 71

* The Average $ of Newest Contracts Written considers the list price when the homes went under contract. Data pulled from Heartland MLS and deemed reliable but not guaranteed. Low samplings in a category can skew results. Stats cover approximately 15 days from post date. DOM = Days On Market.

The last 96 homes sold in Overland Park were on the market an average of 71 days. We look forward to assisting you with buying or selling a home anywhere in the Overland Park area, so please contact us with any questions you may have. You can also find detailed real estate information on our website regarding selling an Overland Park Kansas home and buying an Overland Park Kansas home.

Overland Park Kansas Real Estate Information

Search All Overland Park Kansas MLS Listing

View More Local Market Stats

Listing Agents In Overland Park Kansas

Buyer’s Agents In Overland Park Kansas

Posted by Jason Brown


Memorial Day Weekend Is Here, Community Pools Are Opening And Lake Of The Ozarks Trips Are Being Planned

Checking The Pulse Of The Kansas City Real Estate Market

Memorial Day weekend is finally here, thus kicking off the summer season in Kansas City. For the past month, every time we pass by the pool in our subdivision, the kids bring up how excited they are to jump in. I’m amazed that kids easily forget just how cold the pool is each Memorial Day… or maybe they just don’t care. Anyhow, the time is here as nearly every subdivision pool located and managed by an HOA in the Kansas City area is set to open this weekend. I’m thinking there’s not going to be a single parent in the pool with the cold water and outside temperatures hovering in the 70’s. The Memorial Day weekend also starts the summer season of planning weekend trips to the Lake of the Ozarks.


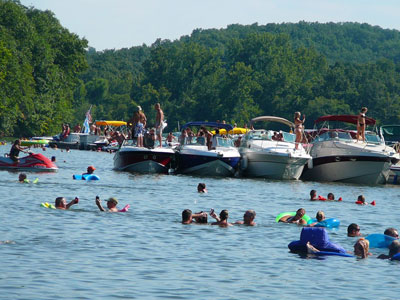
If you’re new to Kansas City area, many people have a second home at the Lake and others plan a trip or two down to the Lake each summer and stay at an area resort. The three-hour drive is well worth the time to get away for a weekend and if you have a boat it’s even better! If you don’t you can rent a pontoon, though that’s probably not recommended on a holiday weekend. I’ve seen fourth of July weekends where the water literally looked like rough ocean water.  If you’re brave enough to travel by water and hang out with the crazies, check out Party Cove… and, if you’re like me and have kids and are afraid of what the kids might see at party cove, Osage Beach is a better option for taking a break from the water activities — you’ll find shopping, dining and fun things to do.


Posted by Jason Brown

Add to DeliciousAdd to DiggAdd to FaceBookAdd to Google BookmarkAdd to RedditAdd to StumbleUponAdd to TechnoratiAdd to Twitter